Home
» New Trends
»
Data-Driven Urban Planning: Building Sustainable and Walkable Smart Cities
Data-Driven Urban Planning: Building Sustainable and Walkable Smart Cities
Data-driven urban planning works best when data is treated as a decision tool, not as the goal. A city can collect traffic counts, smartphone traces, air-quality readings, transit feeds, parcel data, crash records, tree-canopy maps, and resident feedback, yet still make poor choices if it measures the wrong outcomes or ignores who benefits.
To make that practical, this article follows a fictional example: imagine a mid-sized city called Riverton. Riverton is growing, its busiest corridors are congested, some neighborhoods lack continuous sidewalks, summer heat is worsening, and residents say everyday destinations feel too far away without a car. The example is illustrative only; it is not a real city case study or a claim about measured results.
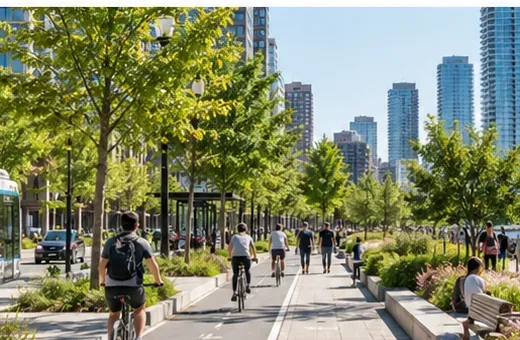
A walkable smart-city corridor combines proximity, safe walking and cycling, public transit, shade, and mixed-use development rather than relying on technology alone.
Start With Outcomes, Not Sensors
Riverton's first mistake would be to ask, “What smart-city technology should we buy?” A better first question is, “What should become easier, safer, healthier, or more sustainable for residents?” That distinction is consistent with UN-Habitat's people-centered smart-city approach, which frames digital transformation around inclusion, sustainability, accessibility, quality of life, and human rights rather than technology for its own sake. See the UN-Habitat World Smart Cities Outlook 2024 and its Centering People in Smart Cities framework.
For Riverton, the outcomes might be straightforward: more residents able to reach schools, groceries, parks, transit, and health services on foot; fewer severe traffic injuries; cooler walking routes during hot weather; more reliable transit; and lower transport emissions. Sensors and software are useful only if they help the city diagnose those problems, compare options, or monitor progress.
Walkability Is About Access, Not Just Sidewalk Length
A city can add miles of sidewalk and still leave people far from useful destinations. For planning purposes, accessibility means the number of opportunities—such as jobs, schools, shops, parks, or clinics—that people can reach within a specified travel time by a particular mode. OECD work distinguishes accessibility from simple proximity and from transport-network performance.
The OECD's 2024 comparison of cities shows why this matters. In countries with available data, 76% of people in urban centers could walk to a primary school and childcare facility within 15 minutes, while the comparable share in suburbs was 36%. The same report found that about one-quarter of residents in urban centers lacked access to a green area within 400 meters. These figures are not targets that every city must copy, but they illustrate a measurable way to move from “walkable-looking streets” to actual access. See the OECD walkable-cities analysis.
In Riverton, planners therefore map 5-, 10-, and 15-minute walking areas around schools, frequent-transit stops, parks, pharmacies, grocery stores, and civic services. The useful question is not simply “Where are sidewalks missing?” but “Which missing link prevents the most people—especially children, older adults, and people with disabilities—from reaching essential destinations safely?”
Build a Baseline From Multiple Data Layers
No single dataset can explain an urban system. Riverton combines several layers because each answers a different planning question.
Data layer
What it can reveal
Planning use
Street network, sidewalks, crossings, curb ramps
Continuity, barriers, intersection spacing
Find missing links and accessibility gaps
Transit routes, stops, frequency, reliability
Where transit is useful in practice
Prioritize bus lanes, stop access, and transfers
Traffic speeds, volumes, crash records
Risk exposure and dangerous corridors
Target speed management and safer crossings
Land use and destinations
Where housing, jobs, schools, shops, and services are located
Measure 15-minute access and mixed-use gaps
Population and socioeconomic data
Who lives where and who may be underserved
Test equity, not just citywide averages
Heat, tree canopy, air quality, flood risk
Environmental exposure along routes
Plan shade, green infrastructure, and resilient streets
Resident surveys and community mapping
Problems administrative datasets may miss
Validate priorities and identify lived barriers
The World Bank's urban work similarly emphasizes city-level data and analytics to guide policy and investment planning. Its SURGE program identifies spatial planning, data and analytics, resilience, and low-carbon development as linked capabilities rather than separate projects. See the World Bank SURGE program.
Use Data to Find High-Leverage Interventions
Suppose Riverton's maps show that several neighborhoods are physically close to a major bus corridor but cut off by six-lane roads with long crossing distances. The city does not need an expensive citywide technology rollout to respond. It might need shorter crossings, median refuges, slower turning speeds, better lighting, curb ramps, and shaded paths to the stops.
In another district, the problem may be land use rather than street design: homes are separated from daily services by zoning patterns that force long trips. There, the most effective intervention may be mixed-use infill, neighborhood retail, housing near frequent transit, or a new public facility rather than another traffic-management sensor.
This is where data-driven planning becomes more than dashboard monitoring. It helps distinguish whether poor access comes from distance, transport performance, street safety, missing services, or environmental conditions—and therefore which investment is likely to address the actual constraint.
Pair Mobility Data With Health and Climate Data
Walkability has direct links to public health. WHO notes that poorly designed urban transport systems can contribute to traffic injuries, air and noise pollution, and barriers to safe physical activity. WHO also promotes walking and cycling because they can improve health while reducing congestion, noise, and emissions. See the WHO urban health fact sheet and its guidance on linking health and urban planning.
For Riverton, that means a pedestrian-priority map should not stop at travel times. The city overlays surface temperature, tree canopy, air pollution, crash risk, and flood exposure. A route that is theoretically a 12-minute walk may not be a reasonable walking route for an older adult if it has no shade, poor crossings, and extreme summer heat.
That broader view can change investment priorities. Trees, shade structures, stormwater features, benches, drinking water, and safer crossings may be mobility infrastructure as much as environmental amenities.
Measure Equity Explicitly
Citywide averages can hide large neighborhood differences. If Riverton raises the share of residents within a 15-minute walk of a park, but nearly all the improvement occurs in already well-served districts, the headline metric can improve while inequality worsens.
Planners should therefore break outcomes down by neighborhood and by relevant population groups where lawful and statistically appropriate. Useful questions include: Are low-income areas receiving the same safety improvements? Can older residents reach pharmacies? Do children have safe routes to school? Are curb ramps and crossings usable for people with disabilities? Is tree canopy being added in the hottest neighborhoods?
UN-Habitat's Sustainable Development Goal 11.7 work stresses universal access to safe, inclusive, accessible green and public spaces, especially for women, children, older people, and persons with disabilities. It also notes that streets make up a large share of urban public space, reinforcing the idea that street design is a social-equity issue as well as a transport issue. See UN-Habitat's public-space indicator guidance.
Use Community Knowledge to Challenge the Data
Administrative and sensor data often describe what is easy to count, not everything that matters. A pedestrian counter can show low walking volumes on a street, but it cannot by itself tell planners whether people avoid the street because it feels dangerous, lacks shade, has inaccessible curbs, or has nowhere useful to go.
Riverton therefore takes draft maps back to residents, disability advocates, school communities, transit riders, local businesses, and emergency services. The goal is not to replace data with anecdotes; it is to test whether the data has been interpreted correctly and whether important conditions are missing.
That feedback can also prevent a common smart-city failure: optimizing an existing system that residents actually want redesigned.
Build Data Governance Before Scaling the Technology
More urban data creates new responsibilities. Mobility data can reveal sensitive patterns. Camera systems can raise surveillance concerns. Vendor platforms can create lock-in. Inconsistent datasets can produce misleading comparisons. And a technically sophisticated model can still be biased if some neighborhoods are undercounted.
The OECD's Smart City Data Governance report recommends clear goals and structures, stronger data-management capacity, privacy and transparency protections, interoperability, and stakeholder participation. The central point is that data governance is part of urban governance, not an IT afterthought.
For Riverton, that translates into practical rules: collect only data needed for a defined planning purpose; document data quality and limitations; set retention and access policies; use aggregation or anonymization where appropriate; publish methodologies for public indicators; require vendors to support interoperable formats; and establish a process for residents to understand how data is used.
Test Interventions Before Committing Citywide
Data-driven planning does not mean every decision needs years of analysis. Riverton can use pilots to turn uncertainty into evidence. A dangerous corridor might receive temporary curb extensions, a bus-priority lane, or a weekend traffic-calming treatment. The city can then compare before-and-after speeds, crossing behavior, transit travel time, pedestrian counts, and resident feedback.
The important part is to define success before the pilot begins. Otherwise, officials can cherry-pick whichever metric makes the project look favorable. A useful evaluation plan specifies the baseline period, target indicators, equity checks, seasonal effects, and what decision will follow each possible result.
A Practical Scorecard for a Walkable Smart City
Riverton does not need hundreds of indicators. A concise scorecard tied to real policy goals is easier to govern and act on. A useful set could include:
Share of residents within a 15-minute walk of key daily services.
Share of residents within a short walk of frequent public transit.
Completeness and accessibility of the sidewalk and crossing network.
Traffic speeds and severe pedestrian/cyclist injuries on priority corridors.
Transit frequency and reliability, not just route coverage.
Tree canopy, shade, and heat exposure along walking routes.
Access to public green space.
Transport greenhouse-gas emissions and mode share.
Neighborhood-level equity gaps for each major outcome.
Resident-reported comfort, accessibility, and perceived safety.
Each metric should have an owner, a refresh schedule, a documented source, and a clear connection to a decision. If a metric never changes a budget, project, policy, or design, Riverton should ask why it is collecting it.
What “Smart” Looks Like in Practice
By the end of the fictional scenario, Riverton is not “smart” because it has the most sensors. It is smarter because it can connect evidence to action: identify who lacks access, distinguish a land-use problem from a transport problem, prioritize streets where safety and heat risks overlap, involve residents in interpreting the data, test interventions, and publish outcomes transparently.
That is the larger lesson of data-driven urban planning. Technology can make cities more observable, but sustainability and walkability still depend on physical design, land use, public transport, public space, institutional capacity, and trust. The strongest smart-city strategy is therefore not a technology plan with an urban appendix; it is an urban strategy in which data and digital tools are used carefully to help people reach more of what they need with less time, risk, cost, and environmental impact.