Home
» News
»
Salesforce Heroku Outage: What Happens to Deployed Applications?
Salesforce Heroku Outage: What Happens to Deployed Applications?
A Heroku outage does not always mean every deployed application is completely offline. The impact depends on which part of the platform is failing: routing, dyno networking, data services, deployment tools, DNS, logging, or an integration such as Heroku Connect. For operators, the fastest way to respond is to identify the affected layer before restarting or changing a healthy application.
Heroku's own incident history shows why that distinction matters. On June 10, 2025, Heroku reported a severe platform disruption that created up to 24 hours of downtime for many customers. Heroku's post-incident summary said an unintended operating-system update restarted networking services on production hosts, while a routing setup flaw prevented correct network routes from being reapplied. The same incident also affected internal tools and the Heroku Status site, complicating diagnosis and communication. Heroku stated that the incident was not a security event and that no customer data was lost. See the official June 10 outage summary.
More recently, on May 8, 2026, Heroku reported a service disruption involving an upstream provider that affected a subset of customers in the North America region. Reported symptoms included intermittent connectivity, elevated database latency, and degraded performance involving third-party add-ons. Heroku later said it migrated affected resources to a new availability zone and restored web applications and databases. The incident history is available on the official Heroku incident page.
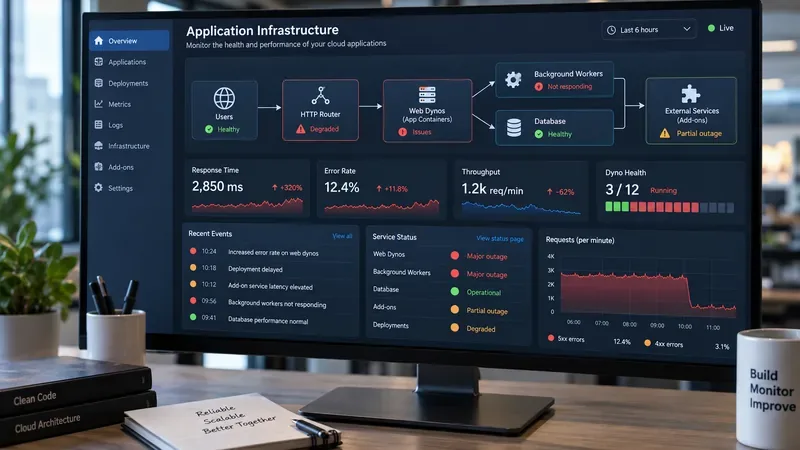
A monitoring view illustrates how a platform incident can affect routing, web dynos, workers, deployments, and add-ons differently while a database remains healthy.
Quick impact matrix: what can break during a Heroku outage?
Affected layer
What users may see
What operators may see
HTTP routing
Timeouts, 503 responses, intermittent requests
Router errors, falling throughput, some dynos unreachable
Dyno runtime or networking
Partial or complete application failures
Dyno relocations, failed connections, H99 or related platform symptoms
Heroku Postgres
Slow pages, errors on data-dependent actions
High DB latency, connection failures, read-only or failover conditions
Heroku Connect
Salesforce-backed data may become stale
Sync lag or paused/error states while app data remains locally accessible
Build/release tools
Existing app may continue serving normally
New deploys, review apps, release tasks, or configuration changes may stall
Dashboard/API/CLI
Usually no direct user-facing effect
Management actions may be unavailable or delayed
DNS
New or changed hostnames may not resolve
New apps/domains inaccessible even if runtime is healthy
1. Running applications can fail even when your code did not change
All Heroku applications run in managed containers called dynos. Web dynos receive HTTP traffic, worker dynos typically process background jobs, and one-off dynos handle administrative tasks. Heroku's dyno documentation explains that the dyno manager is responsible for keeping those containers running.
A platform problem can therefore make a previously healthy release unreachable without any application deployment. If host networking, the dyno manager, or underlying infrastructure becomes unavailable, the application can fail even though its code and configuration are unchanged.
During the June 10, 2025 outage, Heroku described a network failure that severed outbound connectivity for dynos on affected hosts. This is an important operational lesson: an error that looks like an application dependency failure can originate below the application layer.
2. Routing failures can produce 503s, timeouts, or intermittent success
Heroku's HTTP routers receive inbound traffic and forward requests to web dynos. The official routing documentation describes this path from load balancers through routers to application dynos.
If only part of that path is impaired, users may report that the site “sometimes works.” One request can reach a healthy dyno while another fails. This is why multiple checks from different locations are more informative than a single browser refresh.
Heroku's error-code reference is useful when logs remain available. H99 and R99 are specifically documented as platform errors. Other codes can indicate request timeout, refused backend connections, quarantined dynos, or application-level problems, so an H-code by itself should not automatically be blamed on a Heroku-wide incident.
3. A data-service outage can leave the app running but functionally unusable
An application can have healthy web dynos while its database is slow or unreachable. Pages that do not require data may still load, while login, checkout, search, writes, or API calls fail. This creates a partial outage that can look inconsistent to end users.
The May 8, 2026 incident is a useful example because Heroku reported intermittent connectivity and elevated database latency for affected customers. Heroku also advised that affected customers could consider database failover as a mitigation during the incident.
Planned maintenance can create shorter interruptions too. Heroku's Postgres maintenance documentation says maintenance may restart the associated app and that users can see errors or delays for several minutes. Scheduled maintenance and an unexpected platform outage should therefore be distinguished before escalating.
4. Heroku Connect failures can make Salesforce data stale without taking the web app down
Heroku Connect synchronizes data between a Salesforce organization and Heroku Postgres. According to the Heroku Connect documentation, the service provides data synchronization rather than acting as the web runtime itself.
If Connect is disrupted, a deployed application can remain available while synchronized Salesforce data stops updating. Reads from the existing Postgres copy may still work, but users can see stale records or delayed writes depending on the application's mapping and workflow.
Heroku's maintenance documentation states that during Heroku Connect maintenance, synchronization and configuration are unavailable while existing data in Postgres remains accessible; queued changes are retained and synchronization resumes afterward. That behavior is documented in Heroku Connect Maintenance Operations.
5. Deployment problems do not necessarily mean production is down
Operators should separate “cannot deploy” from “application unavailable.” Heroku categorizes builds, Git pushes, deployment APIs, the Dashboard, CLI, and related management operations separately from runtime and data services. A tooling incident may block a new release while the currently running release continues to serve traffic.
This distinction was visible in Heroku's May 5, 2026 incident, when some customers could not create Review Apps, but Heroku explicitly reported that running apps were not affected.
Heroku's Release Phase documentation also notes that if a release-phase task fails, the new release is not deployed and the current release remains unaffected. During an incident, avoid interpreting a stuck pipeline as proof that the live app has failed.
6. DNS incidents can affect newly created apps or domains differently from existing ones
DNS is another case where the scope can be narrow. In September 2025, Heroku reported an upstream DNS issue that delayed provisioning of DNS records for new apps and domains. The official incident noted that newly created hostnames could remain inaccessible until the provider issue was resolved, while the incident scope evolved to include some DNS errors for existing EU-region applications.
For a practical diagnosis, test the existing Heroku hostname separately from a recently added custom domain. Also check DNS resolution independently of application health.
What should you check first during a suspected Heroku outage?
Check Salesforce Trust first. Heroku says Salesforce Trust became the primary incident and maintenance communication channel on October 10, 2025, with the older Heroku Status site retained as a parallel backup during the transition. See Heroku Status documentation.
Determine the affected category. Separate Apps/Runtime, Data Services, and Tools. This prevents unnecessary application changes during a platform incident.
Test more than the homepage. Check a static endpoint, a database-dependent endpoint, background jobs, and a Salesforce-synchronized workflow if applicable.
Review error codes and timestamps. Correlate Heroku router/runtime errors with the official incident start time.
Confirm whether deploys are merely blocked. If production is healthy, avoid forcing a deployment during an unstable control-plane incident.
Preserve evidence. Record request failures, logs, metrics, database latency, incident IDs, and the exact UTC window.
Should you restart dynos during an outage?
Only when the incident guidance or your own evidence supports it. Restarting can help when a particular dyno is stuck, but it can also remove a healthy process or create additional churn during a platform-wide incident.
For the June 10, 2025 incident, Heroku published a specific workaround for Private Space applications: affected customers could stop individual dynos one at a time so that they were replaced. Heroku explicitly warned that this did not guarantee full recovery while upstream services remained impaired and that dynos should not all be replaced simultaneously. That incident-specific guidance is preserved in the official remediation article.
Do not generalize that procedure to every outage. If the database, routing layer, DNS provider, or Heroku Connect is the actual bottleneck, restarting web dynos may accomplish nothing.
Recovery is not complete when the homepage first comes back
After platform availability returns, downstream systems can still be catching up. Heroku said that after the June 2025 outage, delayed status emails were delivered, Heroku Connect synchronization had to catch up, and the release phase had a backlog that took hours to clear.
For a production application, validate recovery across the whole dependency chain:
HTTP success rate and latency have normalized.
All expected web and worker dynos are healthy.
Database reads and writes succeed with normal latency.
Queues and scheduled jobs are processing rather than accumulating.
Heroku Connect mappings are synchronized if used.
Deployments and release-phase jobs are operating normally.
Logs and metrics are arriving without abnormal delay.
Third-party add-ons and external APIs have recovered.
Bottom line
A Salesforce Heroku outage can affect deployed applications at several distinct layers. Runtime and routing incidents can directly make applications unreachable; data incidents can leave processes running but break core features; Connect incidents can make Salesforce-backed data stale; and tool incidents can block deploys without affecting the release already in production.
The best operational response is therefore not “restart everything.” First identify whether the failure is in Apps/Runtime, Data, Tools, DNS, or an integration. Compare your own metrics with Salesforce Trust, preserve evidence, follow incident-specific mitigation guidance, and verify every dependency after recovery. That approach reduces the risk of turning a platform incident into an application incident of your own.