Home
» News
»
Datorama (Marketing Cloud) Down: What Marketers Need to Know
Datorama (Marketing Cloud) Down: What Marketers Need to Know
If Datorama—now called Marketing Cloud Intelligence—looks down, the most important question is not simply “Can I open the dashboard?” For marketers, a stronger recovery standard is: Can I trust the numbers enough to make a decision?
That distinction matters during a broad Salesforce incident. On September 16, 2026, Salesforce reported a service disruption affecting multiple instances across regions, with severe delays, intermittent errors, and periods when some services or support-case creation were unavailable. The incident was tied to request-processing pressure involving a login-related component, and Salesforce rolled out remediation region by region. Marketers should treat that as evidence of a Salesforce-wide availability problem—not automatic proof that every Marketing Cloud Intelligence tenant, connector, dashboard, or data pipeline failed in the same way. Check the live Salesforce Trust status site and your own tenant behavior before drawing that conclusion.
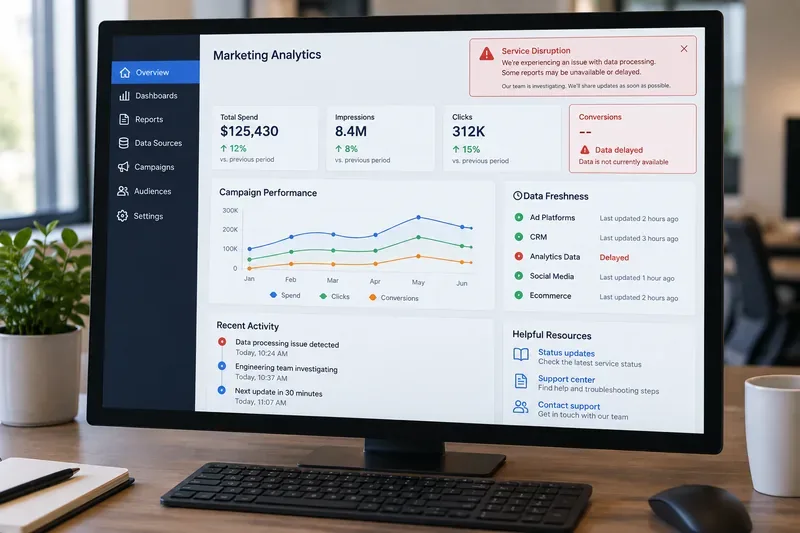
A marketing analytics dashboard with a service-disruption warning and delayed data indicators—the key question during an outage is whether reporting is current and complete enough to use.
What “Datorama down” can actually mean
Salesforce describes Marketing Cloud Intelligence as a platform for connecting, harmonizing, visualizing, and acting on marketing data. Because those activities span several layers, an outage can show up in different ways. You may be unable to sign in, a dashboard may fail to load, a widget may time out, a connector may stop ingesting new records, or the interface may work while the newest data is still missing.
That is why a simple “page loads/page does not load” test is too weak. A previous Salesforce incident affecting Marketing Cloud Intelligence in May 2026 included dashboard-loading problems and delays in data insertion. The service later recovered, but the incident illustrates an important operational point: availability and data freshness are separate quality checks. Salesforce documented that incident on its Trust Status incident record.
A good incident response does not end when someone says “the dashboard is back.” It ends when your team can answer three questions with evidence:
Access: Can the people and systems that need Marketing Cloud Intelligence sign in and complete normal actions without repeated errors?
Freshness: Are the latest expected data loads present, with timestamps that match normal ingestion schedules?
Completeness and consistency: Do totals, dimensions, and key events reconcile closely enough with your primary source systems to support the decision you are about to make?
If all three are satisfied, the platform may be operational enough for normal marketing work. If only access is restored, continue treating recent reports cautiously.
How to verify whether the problem is Salesforce, your tenant, or your data
1. Check Salesforce Trust first
Use Salesforce Trust as the primary source for confirmed incidents and maintenance. Look for the affected product, service, region, instance, start time, and the latest update. A global Salesforce incident can explain login failures without proving that a specific Marketing Cloud Intelligence pipeline has lost data.
The quality signal you want is a Trust update that matches what your team is observing. If Salesforce reports recovery but your tenant still fails consistently, move to tenant-specific diagnostics rather than waiting passively.
2. Test the smallest useful workflow
Do not start by opening the heaviest executive dashboard. Use a small, known report or dataset that normally loads quickly. Confirm that you can sign in, open the workspace, load a simple visualization, and retrieve recent records.
A successful lightweight test tells you the platform is at least reachable. It does not prove that every dashboard, connector, calculation, or scheduled ingestion is healthy.
3. Check data freshness against expected arrival times
Pick a few feeds that matter to the current business decision—for example, paid media spend, conversions, CRM opportunities, or ecommerce revenue. Compare the newest timestamp in Marketing Cloud Intelligence with the newest timestamp in the originating platform or export.
The best sign of recovery is not “the chart has numbers.” It is “the newest expected batch is present, and its timing is back within the normal operating range.” If the source system has 2:00 p.m. data and Marketing Cloud Intelligence stops at 10:00 a.m., the dashboard may be accessible but still operationally stale.
4. Reconcile a few high-value metrics
Choose metrics that are both important and easy to compare: daily spend by platform, conversions by campaign, revenue by channel, or lead counts by date. Compare a recent period in Marketing Cloud Intelligence with the source platform.
Do not demand perfect equality if your normal implementation includes attribution rules, currency conversion, data mapping, deduplication, or delayed source reporting. Instead, compare against your team’s established tolerance. The key is to distinguish a known modeling difference from a new outage-related gap.
A practical quality gate before you resume normal reporting
Check
Good recovery signal
Reason to keep caution
Login and navigation
Repeated tests succeed without unusual errors
Intermittent login failures, timeouts, or repeated retries
Dashboard loading
Known reports load in normal or near-normal time
Widgets are blank, partial, or timing out
Data freshness
Latest expected batches are present
Recent hours or scheduled loads are missing
Source reconciliation
Key metrics fall within normal variance
Unexpected gaps, duplicated totals, or unexplained swings
Scheduled outputs
Exports, alerts, and downstream jobs complete normally
Backlog, failed jobs, or delayed downstream delivery
This gate is intentionally conservative. The right tolerance depends on your reporting architecture and business use. A dashboard used for weekly trend review can tolerate more delay than a pacing dashboard used to pause a large campaign in real time.
When should marketers switch to a fallback process?
Change approach when the platform is unavailable long enough to threaten a real decision deadline, or when data quality remains uncertain after access returns. Useful fallbacks include source-platform reporting, previously validated exports, warehouse queries, or a reduced set of manually reconciled KPIs.
The fallback should be narrower than the normal dashboard. During an incident, fewer verified metrics are better than a broad report with unknown freshness. Label fallback numbers with their source and “data through” time so recipients understand the limitation.
For example, if your paid social dashboards stop refreshing before a same-day budget review, you might use the ad platform’s native spend and conversion totals for pacing while postponing cross-channel attribution decisions until harmonized data is current again.
What not to do during a Datorama outage
Do not assume a blank dashboard means data was deleted. Rendering, login, connector, processing, and data-storage issues can create similar symptoms.
Do not repeatedly rerun large jobs without understanding the failure mode. Retries can create confusion, duplicate work, or a backlog depending on the pipeline design.
Do not publish “final” performance numbers just because the interface is reachable again. Validate freshness and completeness first.
Do not use social posts or third-party outage trackers as your only evidence. They can be useful signals, but Salesforce Trust and your tenant-level tests should drive operational decisions.
When to open a Salesforce support case
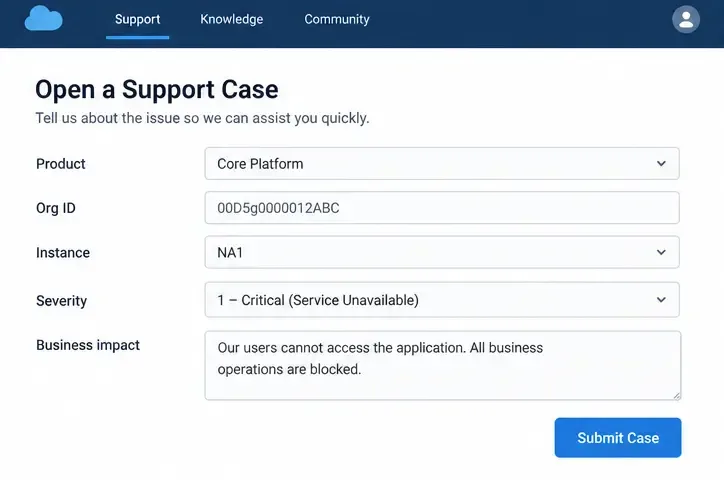
If Salesforce Trust shows no matching incident, or if the public incident is marked resolved while your Marketing Cloud Intelligence environment still shows reproducible failures, open a support case. Salesforce’s support guidance for Marketing Cloud Intelligence asks customers to include the business impact, screenshots of the affected screen or error, reproduction steps, expected behavior, relevant pivot-table or widget URLs or IDs, and details of work performed immediately before the issue.
How to know the incident is truly over for marketing
For a marketer, “resolved” should mean more than a green status page. A strong closeout has four pieces of evidence: users can access the service reliably, current data has caught up, important totals reconcile within normal variance, and scheduled downstream work is completing again.
If one of those is still failing, keep the incident open internally even if the vendor’s broad service status has improved. Vendor recovery can happen before every backlog, connector schedule, or customer-specific workflow returns to normal.
There is also a limit to what an external status page can tell you. Salesforce Trust can confirm platform incidents and affected services, but it cannot prove that your organization’s exact data model, connector schedule, transformations, and downstream decisions are correct. That final verification belongs to your team.
Bottom line
When Datorama or Marketing Cloud Intelligence appears down, optimize for decision-quality recovery, not just screen availability. Check Salesforce Trust, test a small workflow, verify fresh timestamps, reconcile a few high-value metrics, and only then resume normal reporting. If access returns but the data is stale or inconsistent, switch temporarily to a narrower verified source and document the cutoff time. That approach will not eliminate every outage risk, but it gives marketers a clear, measurable standard for deciding when analytics are dependable again.