Home
» Today
»
Why WTI Crude Oil Fell 8% While Gold and Silver Surged — November 4, 2026
Why WTI Crude Oil Fell 8% While Gold and Silver Surged — November 4, 2026
Information verified: November 4, 2026 at 6:51 PM New York time (EST, UTC-05:00; November 4, 2026 at 23:51 UTC). Market session covered: Wednesday, November 4, 2026. This is a post-session explanation of that date, not a live November 5 trading report.
WTI crude oil futures plunged while gold and silver futures surged in the November 4, 2026, U.S. trading session. Delayed Yahoo Finance continuous-futures snapshots put WTI down 8.38% near $88.04 a barrel, gold up 3.34% near $4,072.20 a troy ounce, and silver up 5.52% near $52.325 a troy ounce. The three contracts moved in opposite directions, so it would be misleading to describe this as a broad commodities selloff.
The dominant market narrative was a reassessment of geopolitical risk after U.S. midterm election results: traders anticipated that the new congressional balance could increase pressure for diplomacy over the Iran conflict, reducing the risk premium in oil. Meanwhile, a weaker dollar and declining Treasury yields helped precious metals. Those are contemporaneous market interpretations, not proof that any single headline caused a precise percentage move. Reuters' November 4 oil-market reporting and its precious-metals reporting corroborate the divergent moves and leading explanations.
Destaques: What moved on November 4?
WTI crude: Yahoo's CL=F delayed daily reading fell about 8.38%; separate reporting put the NYMEX WTI settlement at about $88.12 per barrel, down 8.3%.
Gold: GC=F rose about 3.34% in the supplied snapshot, reclaiming the $4,000 area as the dollar weakened.
Silver: SI=F gained about 5.52% in the supplied snapshot, outpacing gold in percentage terms.
Main distinction: Election-related geopolitical repricing was a proposed oil catalyst; the weaker dollar and yields were a more immediate supportive backdrop for metals.
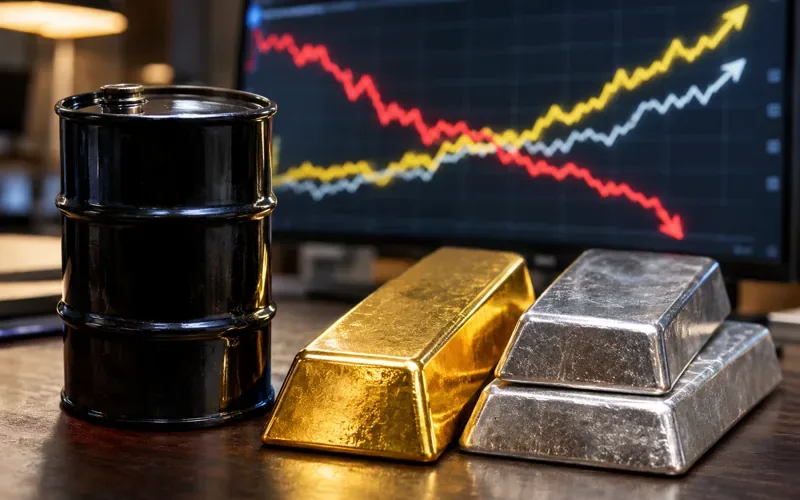
Illustration of the November 4, 2026 commodities split: oil prices fell while gold and silver rose. The pictured market lines are conceptual, not recorded exchange charts.
How much did WTI oil, gold, and silver move on November 4, 2026?
The figures below reproduce the provided Yahoo Finance CL=F, GC=F, and SI=F delayed observations. They compare each observation with its preceding valid daily close in that data feed; they are not labeled as official exchange settlement prices.
Continuous futures proxy
Prior daily close
Nov. 4 observation
Daily change
WTI crude oil (CL=F), USD/barrel
$96.09
$88.04
-8.38%
Gold (GC=F), USD/troy oz.
$3,940.40
$4,072.20
+3.34%
Silver (SI=F), USD/troy oz.
$49.587
$52.325
+5.52%
The feed timestamps cluster around November 4, 2026, 4:59 p.m. New York EST (UTC-05:00; 21:59 UTC), just before the supplied 22:00 UTC daily cutoff (5:00 p.m. EST). A last or delayed quote near that cutoff can differ from the official settlement, which is determined under exchange rules. Reuters separately reported WTI settlement at $88.12, a roughly 8.3% drop; the $88.04 Yahoo observation should not replace that settlement. These generic Yahoo tickers are continuous front-contract proxies: the specific expiration month, historical adjustment convention, and any rollover effect cannot be established from the supplied three records alone. Direction and magnitude were cross-checked against independent session reporting, but contract-specific settlement matching for gold and silver was not fully verified.
For the underlying listings, WTI CL trades on NYMEX, while gold GC and silver SI are COMEX products within CME Group. Their contract sizes and expiration rules differ; see the CME WTI reference, CME gold reference, and CME silver specifications.
Why did WTI crude oil fall more than 8%?
Did the U.S. midterm election results change the Iran-war risk premium?
The November 3 midterm elections produced Democratic control of both chambers of Congress, as reported on November 4. In the energy market, some participants interpreted the result and subsequent administration comments as increasing the chance of negotiation rather than further escalation in the U.S.-Iran conflict. Oil had contained a substantial supply-disruption risk premium amid threats to Gulf shipping and exports; any perceived reduction in that risk can pull futures lower rapidly. Reuters reported that WTI and Brent both sold off sharply and that diplomatic hopes were central to commentary. This is a documented market explanation, not confirmation that a peace agreement was reached or that disrupted supplies were restored on November 4.
Did U.S. oil inventories cause the drop?
The actual government inventory release points in the opposite direction from a simple oversupply story. The U.S. Energy Information Administration's weekly crude-stock series shows commercial inventories falling from 410.625 million barrels for the week ended October 23 to 409.760 million barrels for the week ended October 30, a draw of 865,000 barrels. The EIA release date was November 4. Because inventories fell rather than rose, this report alone does not explain the oil slump. Intraday timing, market expectations and the broader geopolitical repricing matter more than the headline inventory change in isolation.
Why did gold and silver futures jump as oil plunged?
Gold and silver benefited from a softer U.S. dollar and lower Treasury yields following the election outcome, according to Reuters' November 4 precious-metals reporting. A weaker dollar can make dollar-priced bullion less expensive for holders of other currencies, while falling bond yields reduce the relative opportunity cost of holding precious metals that pay no interest. Gold climbed back above $4,000 after prior weakness; silver posted a larger percentage rebound.
Silver often trades with more pronounced percentage swings than gold because it combines precious-metal investment demand with industrial exposure. That structural characteristic can amplify a favorable metals session, although the supplied data do not establish how much of November 4's silver move came from industrial demand, short covering, or speculative position changes. Nor does gold's rise prove that markets became uniformly risk-averse: stocks also advanced in the same session. The more precise description is that different assets responded to different parts of the policy, rates, and geopolitical news.
What could happen in the next trading session, November 5?
These are conditional scenarios, not price targets or forecasts of a guaranteed direction. The next regular U.S. trading date after Wednesday's session is Thursday, November 5, 2026. Traders should monitor official developments on Gulf shipping and negotiations, the dollar, Treasury yields, and whether liquidity and futures-contract prices confirm the delayed data.
Bull case for metals / softer oil: Credible diplomatic progress further reduces oil's supply-risk premium while the dollar and bond yields remain under pressure; gold and silver may retain support.
Base case: No decisive new Iran developments and mixed U.S. data lead to consolidation and two-way trading, rather than an uninterrupted continuation of Wednesday's outsized moves.
Bear case for metals / oil rebound: A renewed shipping threat or military escalation rebuilds the crude-risk premium, while stronger data push yields and the dollar higher, potentially challenging bullion's rally. These forces can also act independently.
The Bureau of Labor Statistics calendar lists preliminary third-quarter productivity and costs for Thursday, November 5, 2026, at 8:30 a.m. New York EST (UTC-05:00; 13:30 UTC) and the October employment report for Friday, November 6, at 8:30 a.m. EST (13:30 UTC). These releases could shift interest-rate expectations and precious-metals pricing. The EIA's published weekly reporting schedule identifies the following petroleum report as November 12 because of the Veterans Day schedule adjustment; no new weekly U.S. crude-stock figure is due November 5.
FAQ: November 4 oil, gold, and silver move
Why was oil down while gold and silver were up?
Traders repriced the risk of further Middle East oil disruption after the U.S. midterms, while a weaker dollar and lower Treasury yields supported precious metals. These are the best-supported contemporaneous explanations, not mechanically proven causes.
Are $88.04 WTI, $4,072.20 gold, and $52.325 silver official CME settlements?
No. They are delayed Yahoo Finance continuous-futures observations for November 4. For example, separate contemporaneous reporting places WTI's official settlement around $88.12. Check the dated, specific-month CME settlement before comparing contracts.
Will gold and silver keep rising or crude keep falling on November 5?
No direction is assured. Watch developments in the Iran conflict, the dollar and Treasury yields, and the November 5 U.S. productivity release; Friday's jobs report is another important risk event. This article is market analysis, not personalized investment advice.